What's the funding ROI on an MOA animation?
For most B2B marketing it's a sum on a napkin. For a biotech raising a round it's a harder question. We put a number on it anyway.
Easy for product marketing. Hard for a raise.
For most B2B marketing the ROI is easy. Spend. Track. Sell. Divide. We did exactly that for one of our CRO clients selling reagents. We built their campaign around a three minute animation and ran it worldwide. For every $1 they spent in advertising on average it made $50 in profit. Easy sum. Anyone can check it.
For a private biotech raising a round, it's not easy. You're not selling a product. You're selling a story to people who write cheques. So what's the ROI on the animation that tells that story?
Well, you can't run the round twice. Once with it, once without.
So we did the next best thing. We measured what happened to our clients, against companies just like them.

Here's what we can tell you.
Nothing sells science like this.
This company needed investors to understand the ELANE pathway. Hard to say in words. Under two minutes on screen. Watch it. That's the whole mechanism. Investor gets it. Partner gets it. Board gets it.
Everything else can go in the deck and the data room. The mechanism is the thing the whole company stands on. Nothing lands it faster than this.
We built the studio on that belief. Belief isn't proof though.
A bad one is worse than none.
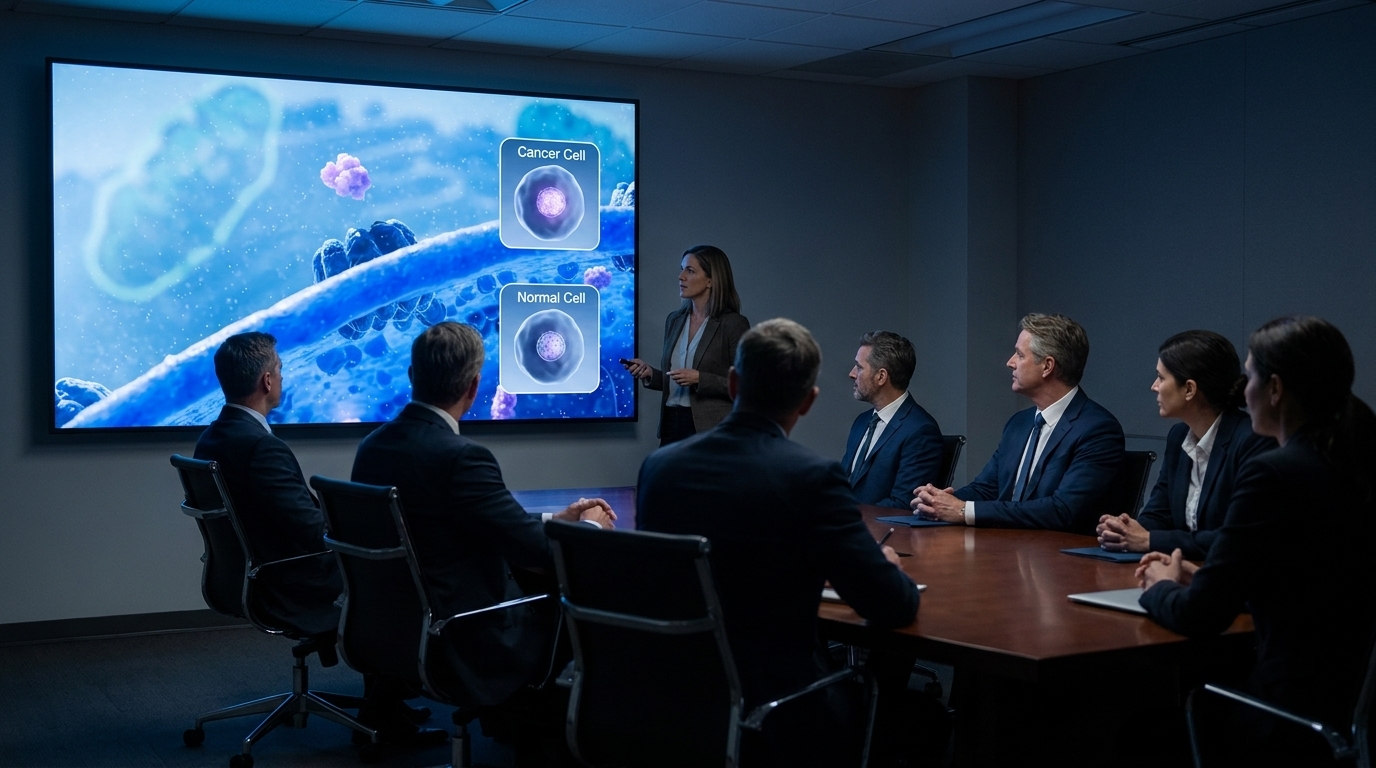
Picture the room. You put up two minutes to show your MOA. And it's not scientifically accurate. Or vague. Or it looks like a machine made it.
What does the room now think of your science? Of your team? If you couldn't get your own MOA across in two minutes, what else got rushed?
There's a bar. Investors have seen the good ones. Anything under that bar doesn't just fail to help. It costs you.
That's why we take the time. And it's why we wanted to know if it actually works.
So we tested it. On our own clients.
As far as we know, no studio has done this.
The question. Do private biotechs that use one of our MOA animations to raise money, raise it more often than companies just like them that never worked with us?
The short answer. 66% of our clients raised in the year after we delivered. 47% of matched companies did. The two groups were the same for two years before. Association, not cause. Here's exactly how we got there.
We picked the clients.
We took every company we'd made an MOA animation for. We cut the CROs, the suppliers and the listed companies. They measure return differently: ad spend against sales, or market activity. This study is about one thing. A private biotech going out to raise.
That left 32 engagements. For each one, day zero is the day we delivered.
We built a comparison group. Three per client.
For every client we found three companies that looked the same on the day we delivered. Using only facts that were public before that day. Nobody was picked for what happened to them after.
We screened 1,094 companies to find 96 that passed every rule. Every fail is logged with the reason. The rules:
We measured everyone the same way.
One question for all 128 companies. Did you announce a raise in each of four windows? Two years before delivery. The year before. The year after. Two years after.
Capital means equity, convertible notes, drawn venture debt, grants, and licensing or milestone payments. Press releases and newswires first. Then filings. Nothing guessed. If we couldn't find it, the answer is No.
Each client is scored against the average of its own three matches. Every client counts the same.
The result.
2 years before delivery
Year before delivery
Year after delivery
2 years after delivery
Share of companies announcing a raise in each 12 month window around the delivery date.
Look at the shape.
Before delivery, the two lines sit on top of each other. Two years running. The year after delivery, they split. 66% against 47%. A 19 point gap. A year later they're back together.
That's what you'd expect if the animation matters for the raise it was made for, and not beyond it. That's the shape of a real effect. Not luck that happened to start on delivery day.
With 32 clients the gap comes with a wide range. Every client we add tightens it. What we can say now is that every number leans the same way.
Conclusion
Private biotechs that used one of our MOA animations to raise money raised it more often in the following year than companies just like them. 66% against 47%.
That's an association. Not proof of cause. A company that commissions an MOA animation is already gearing up to raise. Our matching controls for where a company sits in its funding cycle. It can't control for intent.
So we won't tell you the animation is the only reason. What we'll tell you is the pattern is real, it's positive, and everything in the data points the same direction.
Our clients didn't raise because of the animation. But they raised. 66% against 47%.
Your MOA. Two minutes.
Bring the science. We'll tell you what the room needs to see, and what it takes to make it.